class: center, middle, inverse, title-slide # Data Science for Global Change Ecology ### Carl Boettiger --- class: center, middle, inverse # What is data science? --- class: center, middle, inverse # Why global change? --- class: center # Global Change <img src="images/dimacs/global-change.jpg" width="550"> <small> Overpeck+ (2011) doi:[10.1126/science.1197869](http://doi.org/10.1126/science.1197869) </small> --- class: center # Fishery Collapse? <img src="images/dimacs/worm2006.png", width="700"> <small> Worm+ (2006) doi:[10.1126/science.1132294](http://doi.org/10.1126/science.1132294)</small> --- class: center # Tipping points? <img src="images/berkeley2014/barnosky.png", width="600"> <small> Barnoksy+ (2012) doi:[10.1038/nature11018](http://doi.org/10.1038/nature11018)</small> <!-- From linear to nonlinear thinking. Must deal with the uncertainty--> --- class: center # Remote sensors <img src="images/berkeley2014/landsat2.jpg" width="550"> <small>credit: NASA</small> --- class: center # micro sensors <img src="images/berkeley2014/gps-zebra.jpg" width="500"> <small>credit: NSF </small> --- class: center ## NEON <img src="images/asn2014/neon.png" width="550"> <small> credit: Hopkin (2006) doi:[10.1038/444420a](http://doi.org/10.1038/444420a) </small> --- class: center ## OOI <img src="images/asn2014/ooi.png" width="900"> <small> credit: Witze (2013) doi:[10.1038/501480a](http://doi.org/10.1038/501480a) </small> --- class: center # Computer simulations <img src="img/jetstream-cpus.jpg" width="650"> <small> credit: NSF Cyverse / Jetstream </small> <!-- 9,984 cores 106 teraflops --> --- class: center # Field-based study  --- class: center # Growth of climate data by type  <small> Overpeck+ (2011) doi:[10.1126/science.1197869](http://doi.org/10.1126/science.1197869) </small> <!-- # and growing fast - *data generated worldwide (now dominated by sensor data) is growing by 58% per year* - *in 2010 the world generated 1250 billion gigabytes of data.* - *in 2007 the world produced more data than could fit in all of the world’s storage* <small> Baraniuk (2011) doi:[10.1126/science.1197448](http://doi.org/10.1126/science.1197448) </small> --> --- class: center, middle, inverse # So when is it "Big Data?" --- class: center, middle, inverse # 100 MB? --- class: center, middle, inverse # 100 GB? --- class: center, middle, inverse # 100 PB? --- class: center, middle, inverse # Big enough to be a problem --- class: center # Engineering bottlenecks <img src="images/dimacs/bottleneck.jpg" width="700"> <small> Baraniuk (2011) doi:[10.1126/science.1197448](http://doi.org/10.1126/science.1197448) </small> --- class: center # Science bottlenecks <img src="images/dimacs/science-bottleneck.png"> <small>adapted from Reichman+ (2011) doi:[10.1126/science.1197962](http://doi.org/10.1126/science.1197962)</small> --- class: inverse, middle, center # Different ways to be "Big" ## Volume ## Variety ## Velocity <!-- Each of these can break our hardware (disks/algorithms/networks), but that's relatively generic problem. Particularly interested in how this breaks our _Science_, changes to the research process to that better address this. That is: the management and analysis of massive data in the context global change research Research that _scales_ --> --- class: inverse, middle, center ## Our focus will be on these # *Science Bottlenecks* --- class: middle, center # Data Science  --- class: inverse # Donoho's Greater Data Science 1. Data Exploration and Preparation* 2. Data Representation and Transformation* 3. Computing with Data 4. Data Modeling 5. Data Visualization and Presentation 6. Science about Data Science* - ["50 years of data science"](https://dl.dropboxusercontent.com/u/23421017/50YearsDataScience.pdf) --- ## Course Content: Data Science as Process 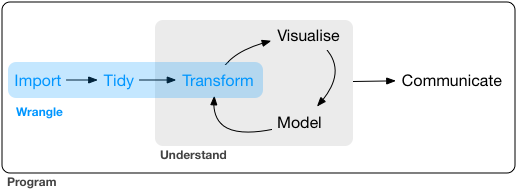 --- ## Data cleaning  --- ## Analysis & Modeling - Formerly the 80% -- - Computational implementations have made this much easier -- - And led to an explosion of new methods & tools --- class: inverse, middle, center # *Science Bottlenecks* --- class: center, inverse, middle # Variety --- class: middle, left, inverse # data visualization > today the visualization and analysis component has become a bottleneck -- - Visualization is time-consuming: becomes only an end-product -- - Web visualizations increasingly interactive, directly tied to data -- - Scientific visualization typically static images, divorced from data <small> Fox & Hendler (2011) doi:[10.1126/science.1197654](http://doi.org/10.1126/science.1197654) </small> <!-- > A consequence of the major effort for visualization is that it becomes an end product of scientific analysis, rather than an exploration tool > stop thinking of visualization as a necessary evil at the end of the scientific pipeline and use it as a tool in data comprehension. > Many other data visualizations on the Web are becoming increasingly more sophisticated and interactive, while at the same time becoming easier to generate thanks to the prevalence of open Application Programming Interfaces .. > Despite the increasing prevalence of these techniques on the Web, we are often looking at tables of numbers, best-fit curves, or other analytic results rather than being able to use visual means when we interact with the complex scientific data in many fields. Many of the visualization tools that are available to scientists do not allow live linking as do these Web-based tools. Once the visualization is created, it is no longer tied to the data ... --> --- class: center <img src="images/dimacs/measurement-error.jpg" width="700"/> # data visualization Something is wrong with this picture... <small> Fox & Hendler (2011) doi:[10.1126/science.1197654](http://doi.org/10.1126/science.1197654) </small> --- class: center, inverse, middle # Variety --- background-image: url(images/Bertrand/factory-farm.jpg) background-size: 100% background-position: center class: center, top, inverse # Factory Farm Data... <small>credit: Arthus-Bertrand</small> --- background-image: url(images/Bertrand/organic-farm.png) background-size: 100% background-position: center class: center, middle, inverse # ... Organic, hand-crafted variety <small>credit: Arthus-Bertrand</small> --- class: center, inverse # Vertically integrated data repositories <img src="images/dimacs/tetris.png"> --- class: center, inverse # Limitations to vertical integration  --- class: middle, center # Unstructured data <img src="img/embed-data-lake.jpg" width = "650"/> --- class: center, middle, inverse # Velocity --- class: center, middle # Velocity: the need for Reproducibility <img src="images/dimacs/growth-climate-data.png" width="350"/> <small> Overpeck+ (2011) doi:[10.1126/science.1197869](http://doi.org/10.1126/science.1197869) </small> ## _Most data are yet to come_ --- class: center # Example: Synthetic analysis of biodiversity loss <img src="images/dimacs/diversity-fig1.png" width="700"> Sythesizes over 140 data sets. --- class: center # Finds no evidence for systematic loss <img src="images/dimacs/diversity-fig2.png" width="700"> How easy would it be to update this to reflect new data? --- class: center, inverse, middle ## In this course, we will reproduce, (and sometimes not), recent and critical scientific results. --- class: center, inverse, middle # Reproducibility: important for other reasons as well: --- background-image: url("images/economist/cover.jpg") --- background-image: url("images/economist/replicate.jpg") --- background-image: url("images/economist/rug.jpg") --- background-image: url("images/economist/trouble.jpg") --- class: center # Reproducible workflows: Dynamic documents <img src="images/dimacs/spectrum.png"> <small>Peng (2011) doi:[10.1126/science.1213847](http://doi.org/10.1126/science.1213847)</small> --- class: inverse, center # This Course -- connecting to... -- # Berkeley's emerging Data Science Curriculum ## Data Science Major ## Data Science Minor --- class: inverse # Real Data, Real Tools -- ## Things will break -- ## Things will change -- # Collaboration & Communication -- ## All work is teamwork -- ## Clean presentation matters most! --- class: inverse, middle, center ## Course motto > Write code for people. Write data for computers > > -- [Vince Buffalo](http://www.vincebuffalo.com/), UC Davis c 2015 --- class: inverse ## Pedagogy Some things in this course are in keeping with good / leading pedagogy -- - We will start with graphs first - active learning, flipped classroom - peer instruction -- Some things aren't -- - Starting on the deep end - We will start with untidy data - unstructured training --- class: center, inverse, middle # Starting in the deep end --- class: center ## Imposter Syndrome <img src="img/imposter.png" width="600"/> --- class: center ## The Science vs The Memo <img src="img/google_memo.png" width="500"/> --- class: center, inverse, middle ## Deliberate practice --- class: center, inverse, middle # Our Tools --- class: center # RMarkdown Notebooks <img src="img/rmarkdown.png" width="450"> --- # GitHub <img src="img/github-espm-157.png"/> --- # Continuous Integration <img src="img/travis.png"/> --- class: inverse ## Language: Why R? -- - Not about the technical attributes -- - Pick your language based on what people in your area speak/code -- - Python vs R: closely analogous feature set; lots of interesting differences to discuss over beer --- class: inverse ## Why tidyverse? -- - [tidyverse manifesto](https://cran.r-project.org/web/packages/tidyverse/vignettes/manifesto.html) -- - Consistent design, parallels tools in other languages (Python/pandas, SQL) -- - Significant adoption in the data science community -- - Pick your language based on what people in your area speak/code --- class: inverse ## Why git? -- - GitHub.com -- - Pick your language based on what people in your area speak/code -- - Very powerful but often convoluted syntax, see <http://stevelosh.com/blog/2013/04/git-koans/> -- - Widely used == easier to get help --- class: inverse ## Our textbook(s) - [R for Data Science](http://r4ds.had.co.nz/) - [Advanced R](http://adv-r.had.co.nz/) Mostly Chapters 1-6 - Additional online resources & scientific data repositories --- class: inverse # The Road Ahead --- class: inverse ## Modules - Global Climate Change (Data exploration & visualization) - Popluation Dynamics (Programming: functions, loops) - Fisheries Collapse (databases) - Extinctions (APIs, regex) - Final project --- class: inverse ## Module flow - Week 1: Introduction, live code examples, getting started - Week 2: Pair work on assignment; mini-tutorials - Week 3: Present / compare / discuss solutions --- class: inverse ## Climate Change - Data parsing - Data visualization - Basic data wrangling - Workflow --- class: inverse ## Population Dynamics - programming: loops, conditionals, functions - ecological simulation - dynamical systems modeling, ODE & SDE simulations, bifurcation analysis, chaos, bet hedging - writing packages --- class: inverse ## Fisheries Collapse - Working with multiple tables/tibbles - SQL databases, relational data - reproducibility --- class: inverse ## Spatial movement - Vector & Raster data - projections and transforms - Simple Features, formats - interactive mapping --- class: inverse ## Extinctions - IUCN Redlist, fossil record, taxonomy - Online data, REST APIs - JSON & extensible data formats - Regular Expressions (RegEx) --- class: inverse ## Course Communication - GitHub - Piazza - Course Website --- class: inverse # Course Website ## <espm-157.carlboettiger.info> - Syllabus: lectures, reading, assignments - Course policies - Helpful links --- class: inverse, center, middle # Questions? --- class: inverse # Your turn: Introductions - Name - Major, year - Semesters of prior programming experience <http://bit.ly/2vanP0s> --- # Forming Teams